The head and shoulders pattern is one of the popular technical analysis patterns in stock trading. This pattern helps to identify price trend reversals and is often used to predict the end of an uptrend or downtrend. In algorithmic trading, the head and shoulders is a typical foundational pattern, making it a suitable starting point for new algorithmic traders exploring pattern-based trading strategies.
Typical Head and Shoulders Pattern
Figure 01 below depicts a typical head and shoulders pattern - a reversal of an uptrend.
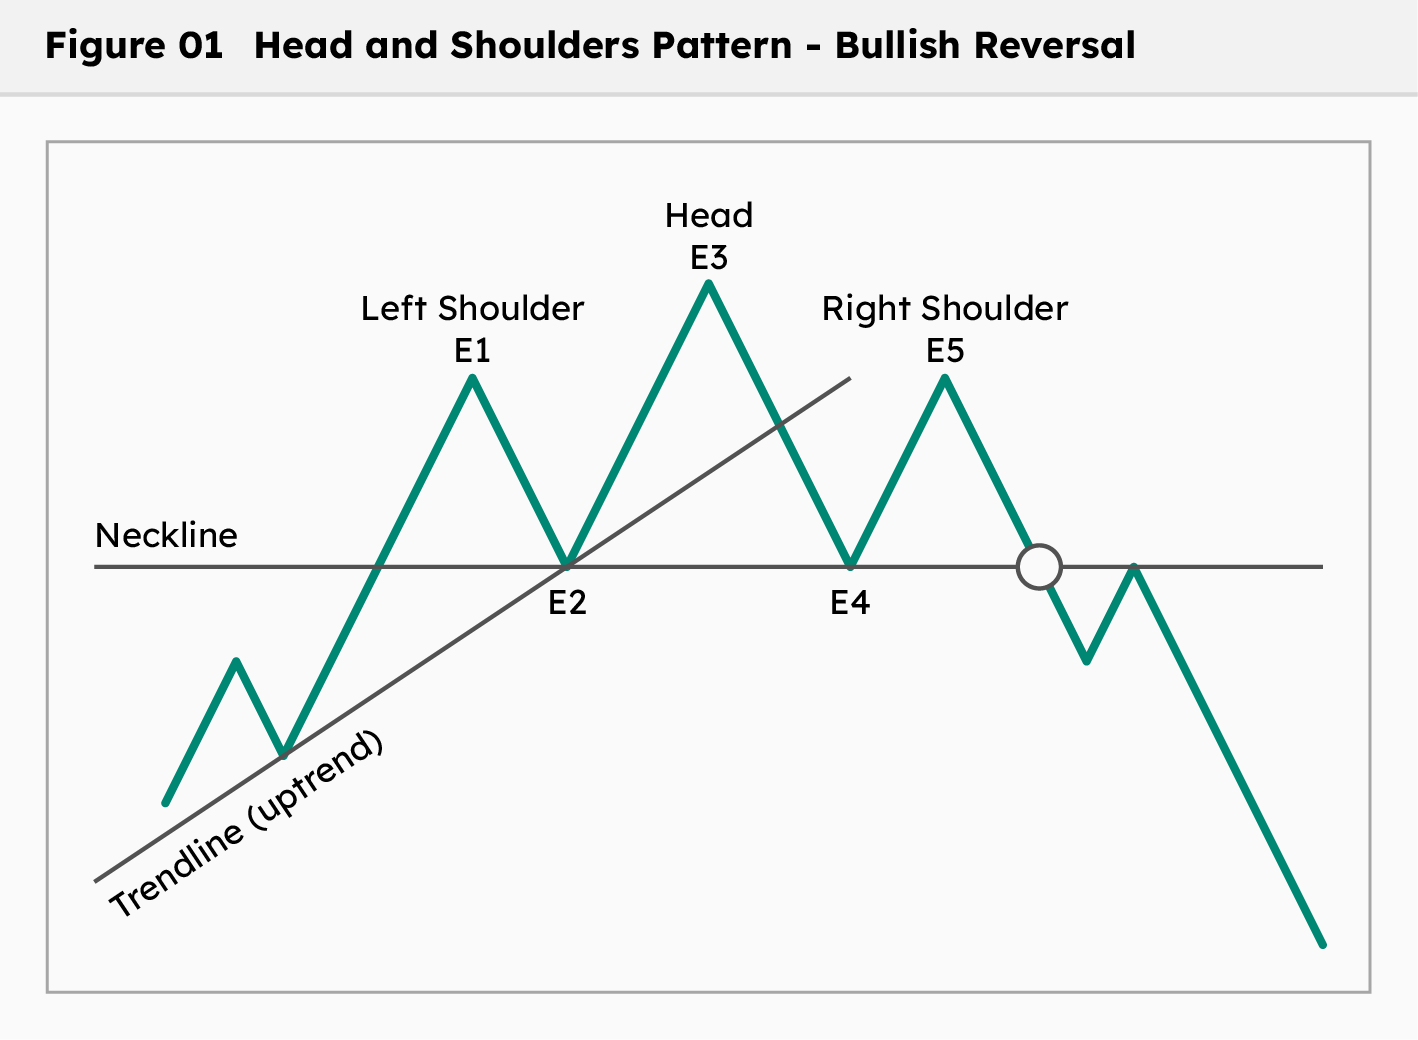
Before forming the head and shoulders pattern, the previous trend was an uptrend, defined by the trendline. Then, the head and shoulders pattern is formed as follows:
-
Left Shoulder: The price experiences a strong rally, with the slope of the rally steeper than the trendline, and often accompanied by high trading volume. After forming a peak at price level E1, the price falls back to price level E2, forming the Left Shoulder. Trading volume during the decline is typically lower than during the rally.
-
Head: An advance follows after the decline of Left Shoulder and establishes a new peak at price level E3. Typically, the trading volume during this rally is lower than that of the Left Shoulder rally, indicating less buying enthusiasm. After that, similar to the development of the Left Shoulder, the price declines back to price level E4, which is almost equal to the previous price level E2, forming the Head.
The line connecting the two lows, E2 and E4, is called the Neckline.
The price falling below the trendline is the first signal that the trend may be coming to an end and that a reversal may be starting.
-
Right Shoulder: The price continues with a second rally up to price level E5, roughly equal to price level E1 (Left Shoulder peak), but fails to surpass price level E3 (Head peak). When the price breaks the Neckline, completing the head and shoulder pattern, it is a signal confirming a trend reversal and the start of a downtrend.
Trading volume plays an important role in analyzing the head and shoulders pattern. When the price increases to form the Head without high trading volume, it indicates weakening buying power and signals the presence of fewer bullish investors. In technical analysis, a divergence occurs when one indicator shows a new peak (or trough) while another indicator shows the opposite. In such cases, the Right Shoulder will have an even lower trading volume than the Head, indicating that the buying demand is exhausted and selling pressure is about to dominate. Additionally, a large trading volume when the price crosses below the Neckline confirms the strength of the downtrend, increasing the reliability of the pattern.
In reality, the perfect head and shoulders pattern as described above is very rare. Common variations include two peaks in the Shoulders or Head, or two Shoulders that are not equal in height. These imperfect variations make quantifying the head and shoulders pattern challenging for algorithmic traders. However, despite the variation, the head and shoulders pattern retains its main characteristics such as the Head peak should be higher than the two Shoulder peaks (E3>E1 and E3>E5), and the two Shoulder peaks should be relatively equal in height (E1≈E5). Additionally, the Neckline does not have to be a perfect horizontal but should not be too steep.
The head and shoulders pattern can also form in the opposite direction and serves as a reversal pattern for the previous downtrend - See figure 02.
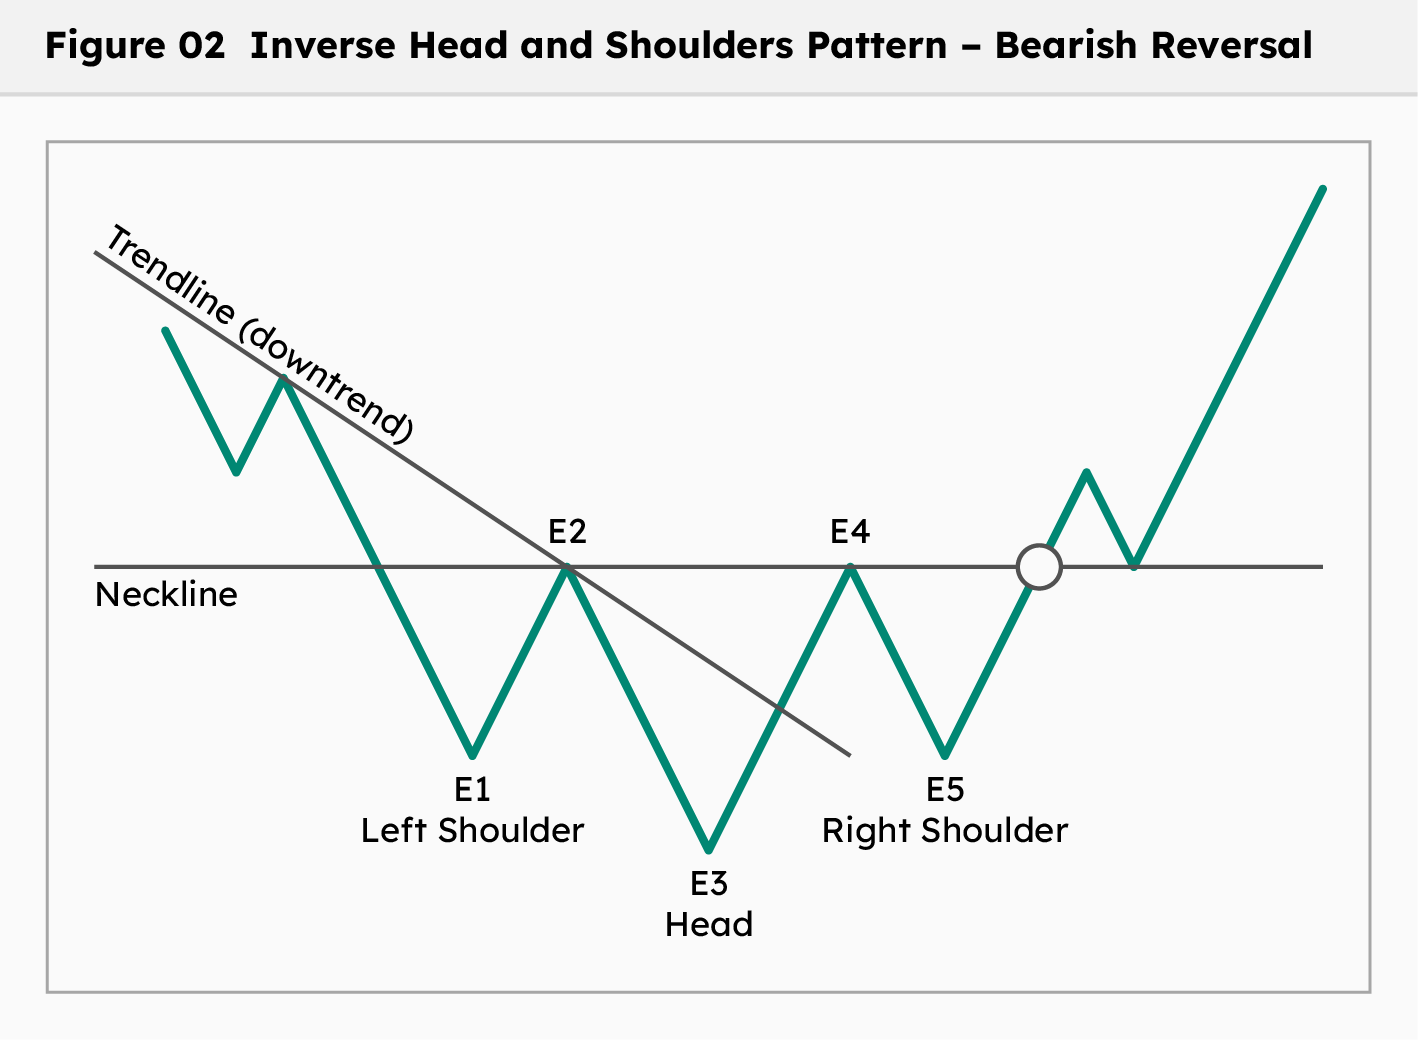
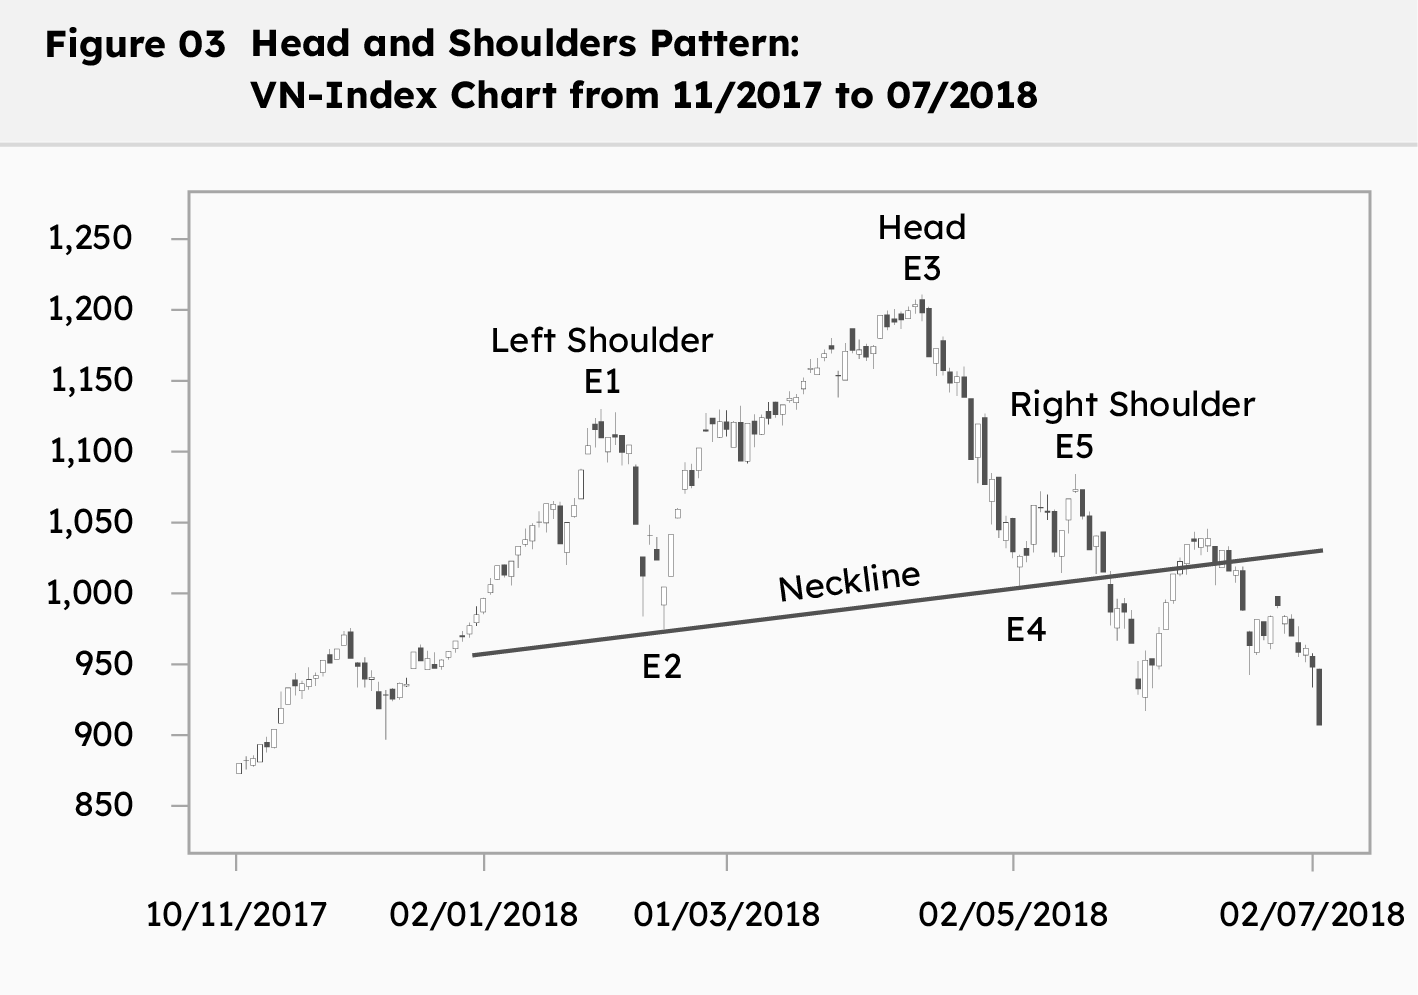
Figure 03 below is an example of a head and shoulders pattern identified in the VN-Index chart for the period from 11/2017 to 07/2018.
Trading Strategy Using Head and Shoulders Pattern
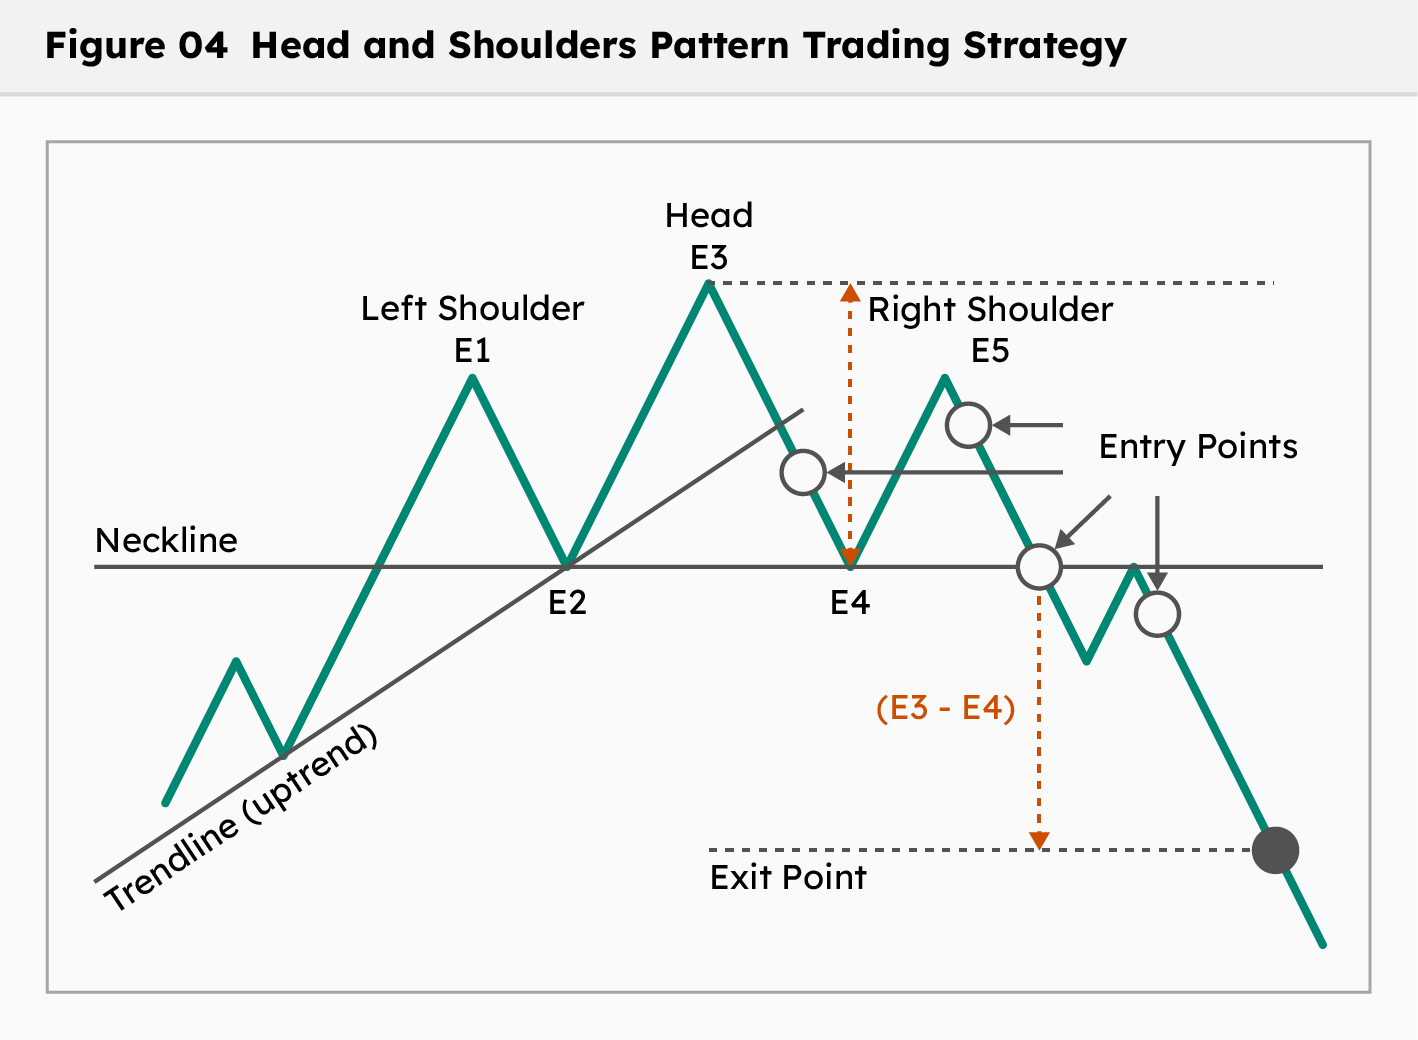
A popular trading strategy with the head and shoulders pattern is to open a short position when the price crosses below the Neckline and close it at the target price calculated as follows:
Target price = E4 - (E3 - E4)
Price signals that cross below the Neckline can sometimes be noise. Therefore, to ensure a clear break of the Neckline, investors can adopt a strategy of waiting for the price to drop to a significant level below the Neckline (usually 3% or 5%) and/or a specified time limit during which the price stays below the Neckline before opening a position; when using the daily price chart, the time limit rule can range from a few days to a few weeks.
Depending on the investor's risk tolerance, the position opening point can be earlier or later than the popular strategy mentioned above:
-
Open a position when the price retraces the Neckline: After breaking the Neckline, the price usually experiences a pullback but does not surpass the Neckline before continuing to decline. This presents a second opportunity to open a position with lower risk.
-
Open a position when the Right shoulder is forming: when the Right Shoulder has formed the E5 peak and starts to decline, investors can open a position before the price crosses below the Neckline.
-
Open a position when the price declines from the Head peak: when the price declines from the E3 peak and crosses below the trendline, investors can open a position with the expectation that the head and shoulders pattern will be created.
Regardless of the position opening point, investors should have a stop-loss strategy to limit risk in case the pattern does not form as expected. Moveover, investors should not rely solely on the head and shoulders pattern to make the trading decisions. It is essential to combine this pattern with other technical analysis indicators and fundamental analysis to gain a more comprehensive view of the market.