What Is a Moving Average?
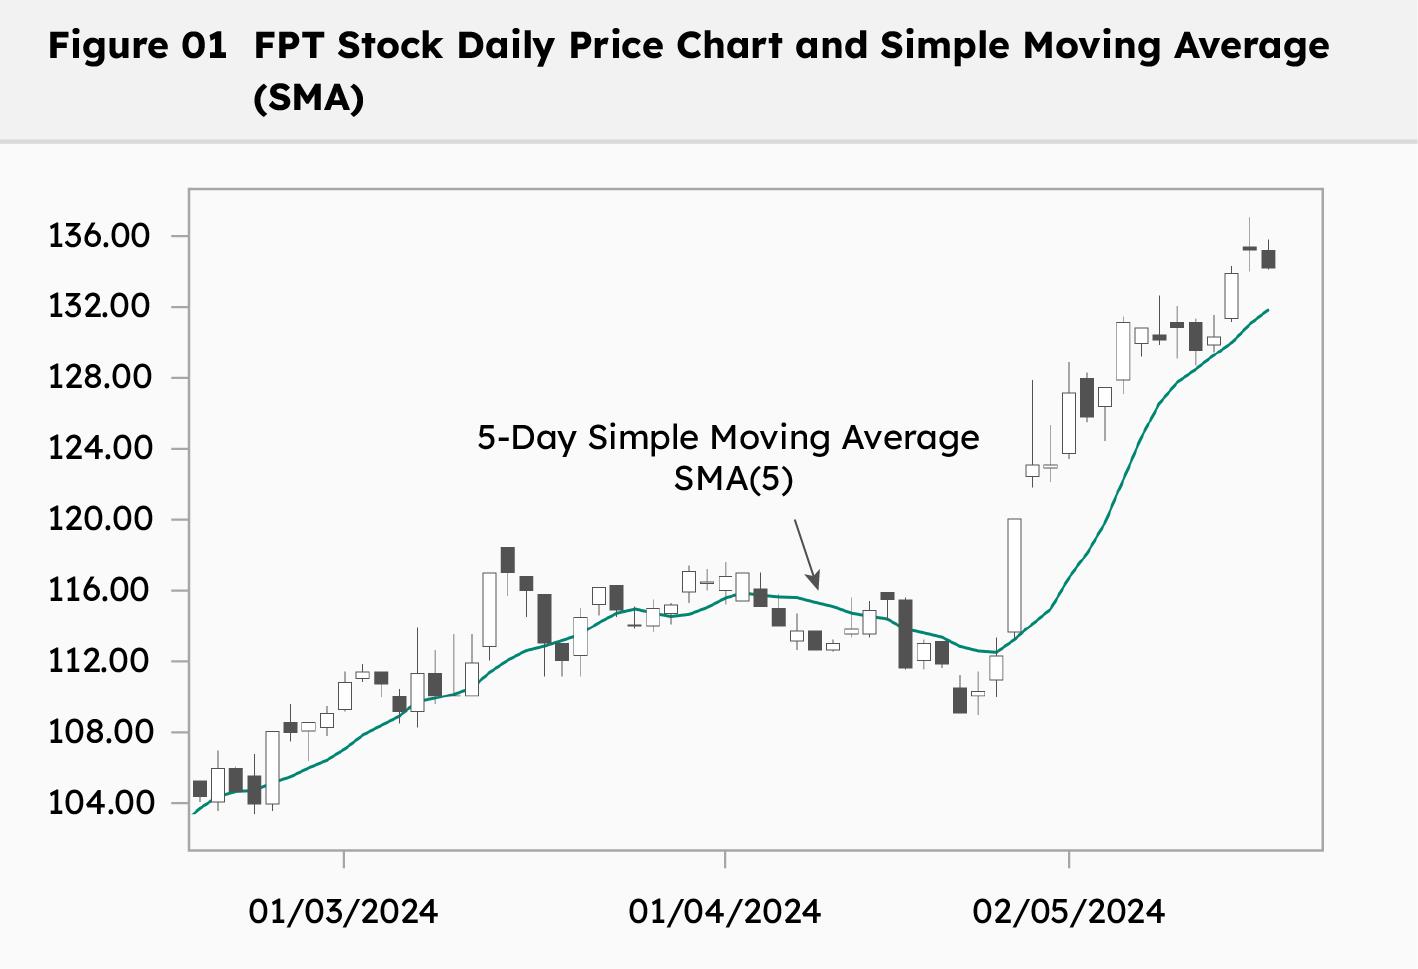
Moving average (MA) is the average price of a security over a specific number of periods. Moving average smoothes out short-term price fluctuations, giving technical analysts a clearer view of market trends (Figure 1).
Technical analysts often use a Simple Moving Average (SMA), in which each price level is equally weighted in calculating the calculation. Some technical analysts prefer to use an Exponential Moving Average (EMA), also known as an exponentially smoothed moving average, where the most recent price levels have the greatest weight, decreasing exponentially for older prices.
A Linearly Weighted Moving Average (LWMA) is another type of moving average similar to EMA, however, instead of exponential smoothing, LWMA assigns linearly decreasing weights to older prices.
Formula
Below is the calculation formula for the 03 types of moving averages mentioned above.
Simple Moving Average (SMA)

Where:
-
N: The number of periods used to calculate the average (the period length can be 1 minute, 5 minutes, 1 hour, 1 day, etc.)
-
SMAt(N): Simple moving average at period t, calculated based on stock price of the most recent N periods;
-
Pt: Stock price at period t (can be closing price, opening price, high price, low price or average price of the period).
Exponential Moving Average (EMA)

Where:
-
EMAt(N): exponential moving average at period t.
Linearly Weighted Moving Average (LWMA)

Where:
-
LWMAt(N): linearly weighted moving average at period t, calculated based on the stock prices of the most recent N periods.
Example of Moving Average Calculation
Presented below are the calculation results for SMA, EMA and LWMA based on daily price data of FPT from 2/1/2024 to 15/1/2024, using the coefficient N = 5 days. The price used in calculation is the closing price of each day (unit: 1.000 VND).

The SMA calculation for 8/1/2024 and 9/1/2024 is calculated as follows:


The LWMA calculation for 8/1/2024 and 9/1/2024 is calculated as follows:


To calculate the EMA, it is important to determine the initial EMA value. Typically, this value is achieved by using the SMA formula:

After determining the initial EMA, the EMA for 9/1/2024 and 10/1/2024 is calculated as follows:


How to Use
Moving averages can be used in various ways. Firstly, whether the price is above or below the moving average is a signal for trend identification. In general, when the price crosses above the moving average, it indicates an uptrend in the stock. Conversely, when the price falls below the moving average, it suggests a downtrend in the stock.
Secondly, the distance between the moving average and price is also important information. After a downtrend, when the price returns to the moving average, this line can act as resistance level. Similarly, when the price begins to decrease after an uptrend, the moving average can act as a support level.
Additionally, two or more moving averages can be combined for enhanced analysis. The 5-day moving average is often used as a short-term momentum indicator, while the 20-day or 60-day moving average can be viewed as a long-term trend indicator. When the 5-day moving average crosses above the long-term moving average can be used as a buy signal, and conversely, the 5-day moving average crosses below the long-term moving average can be used as a sell signal.
In algorithmic trading both in Vietnam and globally, the moving average is the most commonly used technical indicator. All third-party softwares such as AmiBroker, TradingView or MetaTrader have integrated moving average indicators due to its simplicity of calculation as well as its application across various financial markets, owing to its reliance solely on price and volume data. Despite its status as a foundational concept in technical analysis, the profitability of this indicator has dwindled considerably.